


For OEM engineers and fleet procurement teams, wheel hub bearings are not spare parts — they are wheel-end reliability systems that directly influence fleet uptime, failure risk, and total cost per kilometer (CPK).
Modern procurement decisions are increasingly shifting away from unit price comparison toward a system-level evaluation framework:
Failure probability + lifecycle stability + downtime exposure
1. True Lifecycle Cost Structure (TCO Breakdown Model)
In real fleet operation, bearing purchase cost typically represents only a small portion of total lifecycle cost. The dominant cost driver is system downtime, and actual distribution may vary depending on load conditions, environment, and maintenance strategy.
| Cost Component | Typical Share | Engineering Meaning |
|---|---|---|
| Bearing Unit Cost | 10–25% | Material + manufacturing cost |
| Labor & Maintenance | 20–30% | Installation + service labor |
| Secondary Damage | 10–20% | Hub, axle, brake system wear |
| Downtime Cost | 25–50%+ | Fleet operational loss (highly condition-dependent) |
Key Insight: Small changes in failure rate can create disproportionate changes in lifecycle cost due to downtime amplification effects.

2. Engineering Lifecycle Model of Wheel Hub Bearings
Real-World Service Life Ranges (Reference Conditions)
- Light-duty: 150,000–300,000 km
- Medium-duty: 200,000–400,000 km
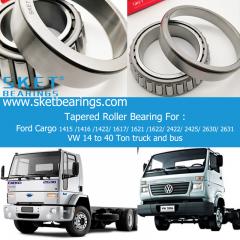
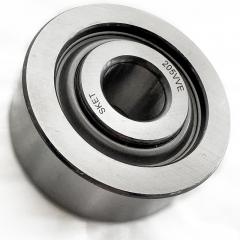
- Heavy-duty: 300,000–600,000+ km — heavy-duty truck wheel hub bearings
Failure Distribution Behavior (Field Model)
Bearing life follows a probabilistic wear-out pattern, often described using Weibull-type distribution behavior. Actual variation depends strongly on operating conditions.
- Early failure zone: installation variation / contamination ingress
- Stable life zone: controlled fatigue under lubrication balance
- Wear-out zone: accelerated fatigue and thermal instability

3. Engineering Root Causes of Bearing Failure
3.1 Contamination Ingress (Primary Failure Driver)
When particles exceed lubrication film thickness (~0.5–1.0 μm EHL film), surface fatigue mechanisms such as micro-pitting may initiate.
- Dust ingress → abrasive wear
- Water ingress → lubrication degradation
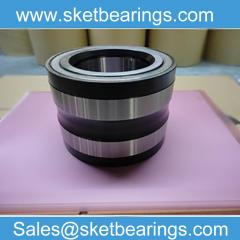
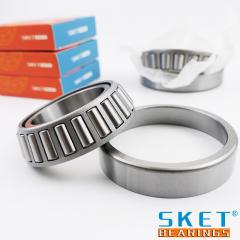
- Seal degradation → accelerated fatigue — sealed tapered roller bearings for contaminated wheel-end conditions
3.2 Lubrication System Degradation
- Oxidation reduces viscosity stability
- Oil separation weakens film strength
- Boundary lubrication increases metal contact probability

3.3 Preload Deviation Sensitivity
- Excess preload → thermal rise and energy loss
- Insufficient preload → vibration instability and uneven load distribution
Critical Note: Preload deviation impacts bearing life in a non-linear (not proportional) manner.
4. Key Design Parameters Affecting Bearing Life
| Parameter | Recommended Range | Impact |
|---|---|---|
| Surface Roughness (Ra) | 0.2 – 0.4 μm | Lubrication film stability |
| Operating Temperature | < 120°C | Grease oxidation control |
| Contamination Limit | < 10 μm particles | Abrasive wear threshold |
| Preload Tolerance | ±10–15% | Fatigue stability |
5. Cost per Kilometer (CPK) Fleet Model
TCO = Purchase Cost + Maintenance Cost + Downtime Cost + Risk-Weighted Failure Cost
| Bearing Grade | Lifecycle | Failure Risk | Cost per km |
|---|---|---|---|
| Low-cost aftermarket | Short | High variability | High (volatile) |
| Standard OEM | Medium | Moderate | Stable |
| Engineered Sealed System | Long | Lower risk (condition-dependent) | Lowest total CPK in many fleet scenarios |
Insight: Lower unit price may increase total lifecycle cost when failure probability and downtime are considered.
6. Fleet-Level Cost Simulation (Decision Model)
Scenario: 50-truck fleet over 3 years
- Low-grade bearings: ~1 failure / 180,000 km (typical assumption under mixed conditions)
- Engineered bearings: ~1 failure / 400,000 km (reference condition dependent)
Resulting impact range:
- Downtime reduction: ~30–55%
- Maintenance interventions: ~20–30% reduction
- Total bearing-related cost: ~20–40% reduction (varies by operation model)
Key Insight: Reliability improvement produces non-linear cost leverage at fleet scale.
7. Failure Mechanism Map (Engineering View)
- Contamination → abrasive wear → micro-pitting
- Lubrication loss → boundary contact → heat rise
- Preload error → stress imbalance → fatigue cracking
- Thermal cycling → grease breakdown → film collapse
8. Engineering-Based Procurement Checklist
- Verified L10 / statistical fatigue data
- Seal ingress resistance validation
- Lubrication stability under thermal cycling
- Preload installation tolerance definition
- Production consistency and traceability control
9. Bearing Replacement Indicators (Field Diagnostics)
- Progressive wheel-end noise increase
- High-speed vibration instability
- Hub temperature rise (>15–20°C baseline deviation)
- Uneven tire wear pattern
- ABS signal fluctuation
10. Engineering Solutions (System View)
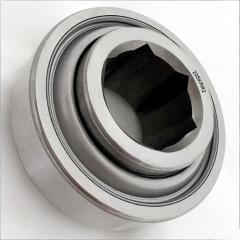
Heavy-Duty Application Range
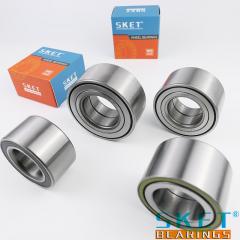
Designed for long-haul stability and extended service intervals — SKET heavy-duty wheel hub bearings
Contaminated Operating Conditions
Optimized sealing systems for dust and moisture environments — sealed tapered roller bearings
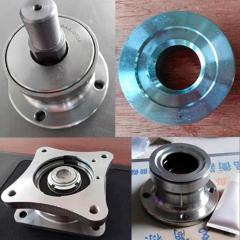
OEM Integration Applications
Dimensional and preload-controlled compatibility solutions: 803194A · 3782/3720
11. Procurement Decision Summary
Wheel hub bearing selection should be treated as a reliability and downtime risk decision, not a unit price optimization problem.
The correct evaluation framework is:
Reliability × Lifecycle Stability × Downtime Exposure = True Cost per Kilometer
12. Engineering Assessment & RFQ
For OEM programs, fleet optimization, and lifecycle cost evaluation:
Request a failure risk and lifecycle cost assessment for your fleet bearing program
Conclusion: The most effective cost optimization strategy is reducing system-level failure probability under real operating conditions, not minimizing unit price.